Spectral Signatures of Artificially Aged vs. Naturally Aged Textiles
Beyond Visual Color Matching
Two textile samples can look identical to the eye under one light source but have completely different spectral reflectance curves. This happens because the eye reduces the full visible spectrum (400-700nm) to just three cone signals (roughly red, green, blue). Many different spectral compositions can produce the same three-signal combination — they are metameric matches.
For authentication, this means that visual inspection alone cannot distinguish between a genuine textile and a good forgery. Spectral analysis can.
Why Spectral Curves Differ
Natural aging produces specific degradation products. When indigo degrades under UV over decades, it produces isatin and other specific compounds. These degradation products have their own spectral absorption signatures. The resulting reflectance curve is a composite of residual indigo, isatin, and further degradation products — each contributing specific spectral features.
Artificial aging often uses different chemistry. A forger aging indigo with bleach produces a different set of degradation products than natural UV aging. The bleach-degraded indigo may look the same to the eye but has different spectral features because the molecular fragments are different.
Multi-factor aging creates complex spectral signatures. Natural aging involves UV, oxidation, humidity, and pollutants acting simultaneously. The resulting spectral curve reflects the combined contributions of multiple degradation pathways. Artificial aging that applies only one or two factors produces a simpler spectral signature.
What to Look For
Spectral curve shape. Compare the reflectance curve of the suspect textile to:
- A predicted curve from a degradation model (based on the claimed provenance)
- Published curves for genuine textiles of similar type, age, and condition
- Curves from known artificially aged comparison samples
Discrepancies in curve shape — even at wavelengths where the overall color looks the same — indicate different degradation chemistry.
Absorption band positions. Specific degradation products absorb at characteristic wavelengths. The presence or absence of specific absorption bands can confirm or deny specific degradation pathways.
Curve smoothness. Natural aging over decades tends to produce smooth, gradually varying spectral curves. Some artificial aging methods produce spectral anomalies (sharp features, unusual shoulders) that do not match natural degradation.
Practical Measurement
Equipment needed:
- Fiber optic reflectance spectrometer (FORS) with full visible range (350-750nm minimum)
- Reference standards for calibration
- Database of reference spectra (genuine and artificially aged)
Measurement protocol:
- Measure the suspect textile at multiple points
- Measure any areas of different aging level (protected vs. exposed)
- Compare to model predictions for the claimed provenance
- Compare to reference spectra from the database
- Document all discrepancies
Case Study: Detecting a Bleach-Aged Indigo
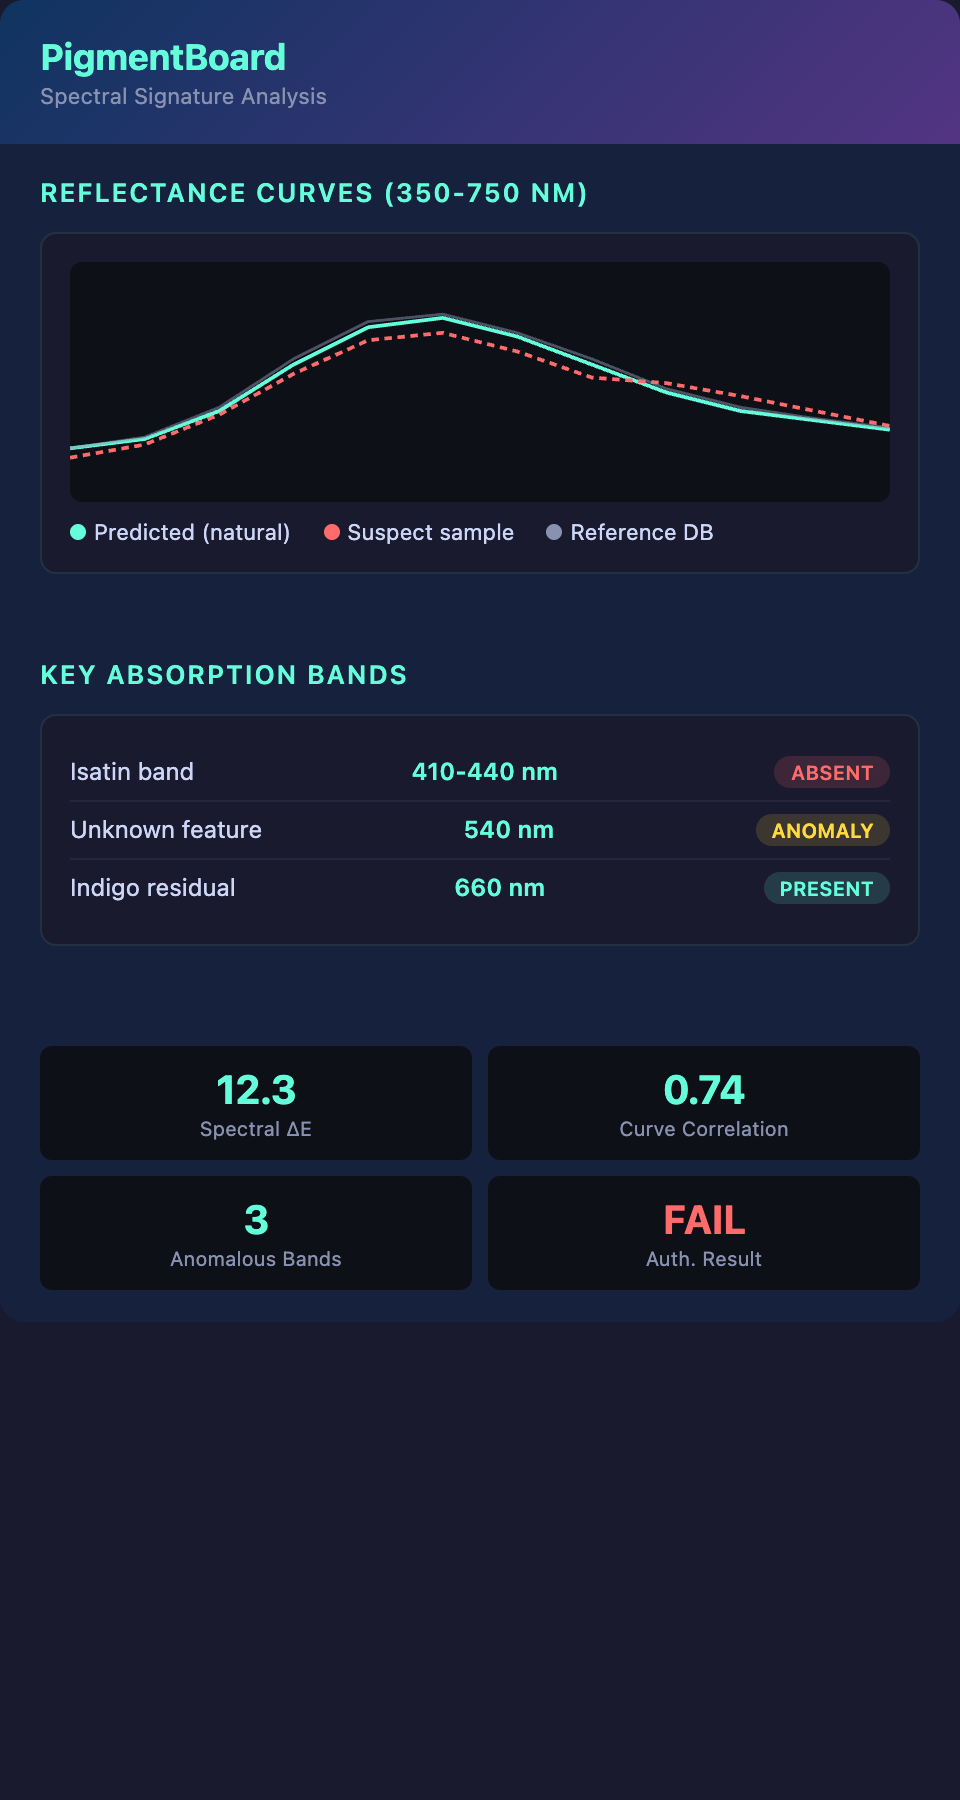
A textile claimed to be an 1840s indigo-dyed cotton shows visual color consistent with the claimed age. Spectral analysis reveals:
- A reflectance curve with a sharper blue-to-green transition than typical naturally aged indigo
- Absence of the characteristic broad absorption at 410-440nm associated with isatin (a natural UV degradation product)
- Presence of a slight absorption feature at 540nm not seen in naturally aged indigo
Interpretation: The indigo was chemically discharged (bleached), not UV-degraded. The claimed provenance is inconsistent with the spectral evidence.
Building a Spectral Reference Database
The power of spectral authentication increases with the size of your reference database. Every genuine, dated textile you measure adds a data point. Over time, you build:
- Spectral profiles for major dye types at various stages of natural aging
- Spectral profiles for common artificial aging methods
- Statistical ranges for "expected" spectral features at specific ages
This database is the foundation of quantitative authentication — and every measurement improves it.
Ready to compare suspect textiles against degradation-modeled spectral predictions? Join the PigmentBoard waitlist.